7. Matplotlib
Powerful tool for visualization
Many tutorials online. We only go over the basics here
import matplotlib.pyplot as plt
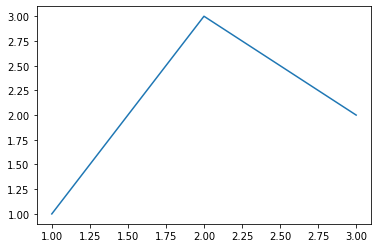
# line plot
x = [1,2,3]
y = [1,3,2]
plt.plot(x,y)
[<matplotlib.lines.Line2D at 0x17056d253a0>]
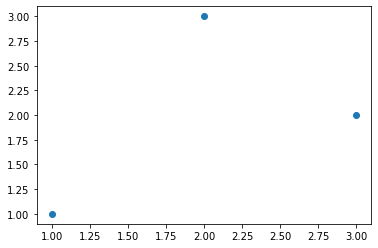
# scatter plot
plt.scatter(x,y)
<matplotlib.collections.PathCollection at 0x17b1b530490>
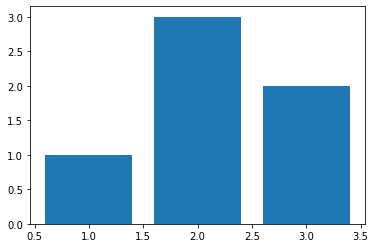
# bar plots
plt.bar(x,y)
<BarContainer object of 3 artists>
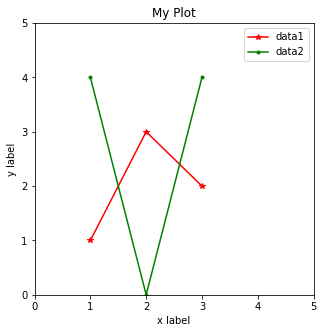
# plot configurations
x = [1,2,3]
y1 = [1,3,2]
y2 = [4,0,4]

# set figure size
plt.figure(figsize=(5,5))

# set axes
plt.xlim(0,5)
plt.ylim(0,5)
plt.xlabel("x label")
plt.ylabel("y label")

# add title
plt.title("My Plot")

plt.plot(x,y1, label="data1", color="red", marker="*")
plt.plot(x,y2, label="data2", color="green", marker=".")
plt.legend()
<matplotlib.legend.Legend at 0x17b1b669d00>